Chromatic Data
TAKE THE EMOTIONAL TEMPERATURE OF A MOMENT IN TIME.
As part of an exhibit or in a stand-alone workshop, the Chromatic Data Project teaches Empotinal Awareness - one of our 4 Tools 4 Mental Health.
The activity creates a beautiful image of a moment in time that can be a permanent exhibit.
Participants are asked to identify something that stresses them out (a Stressor) and something that lifts them up (a Strength).
Each topic is color-coded according to the area it falls under: Self, Family, Friends, School, Activities, Work, or ‘the Wider World”.
The resulting collection is a snapshot of positive and negative factors affecting a specific population, place, group, and time period.
Make a monochromatic work of art
Controlling or limiting your color palette can make an image stronger.
MONO = one, CHROMA = color. Find examples of monochromatic works in the gallery.
Realistic? Abstract?
Or something in between?
How you depict your STRESSOR and STRENGTH is completely up to you.
Whether anyone else understands it doesn’t matter!
Everything you need is included
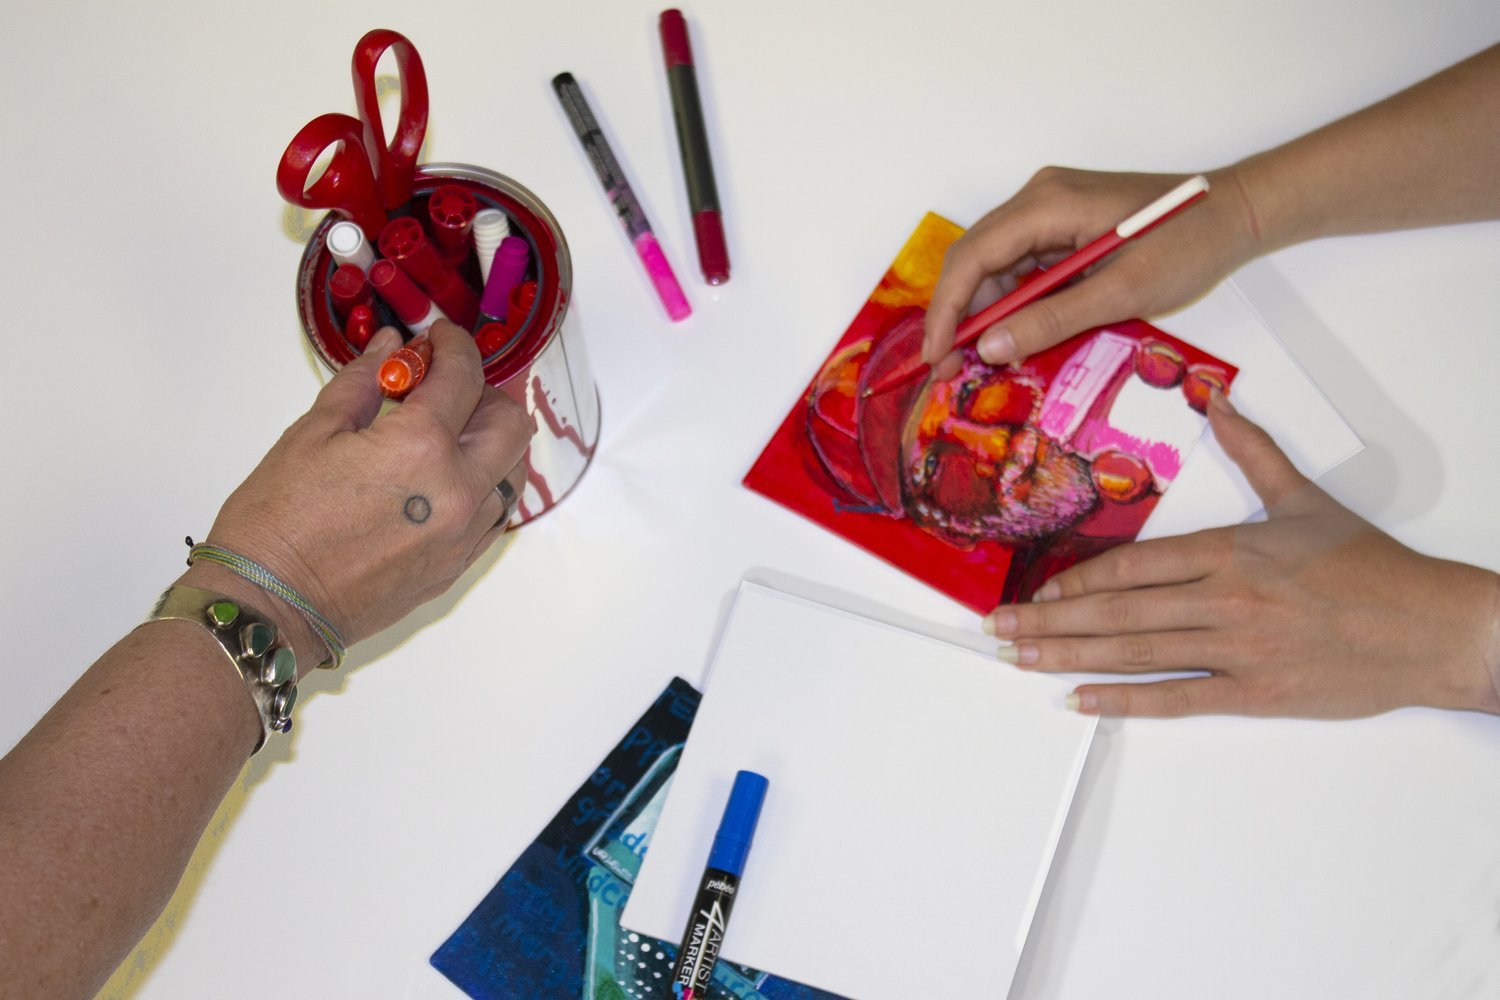
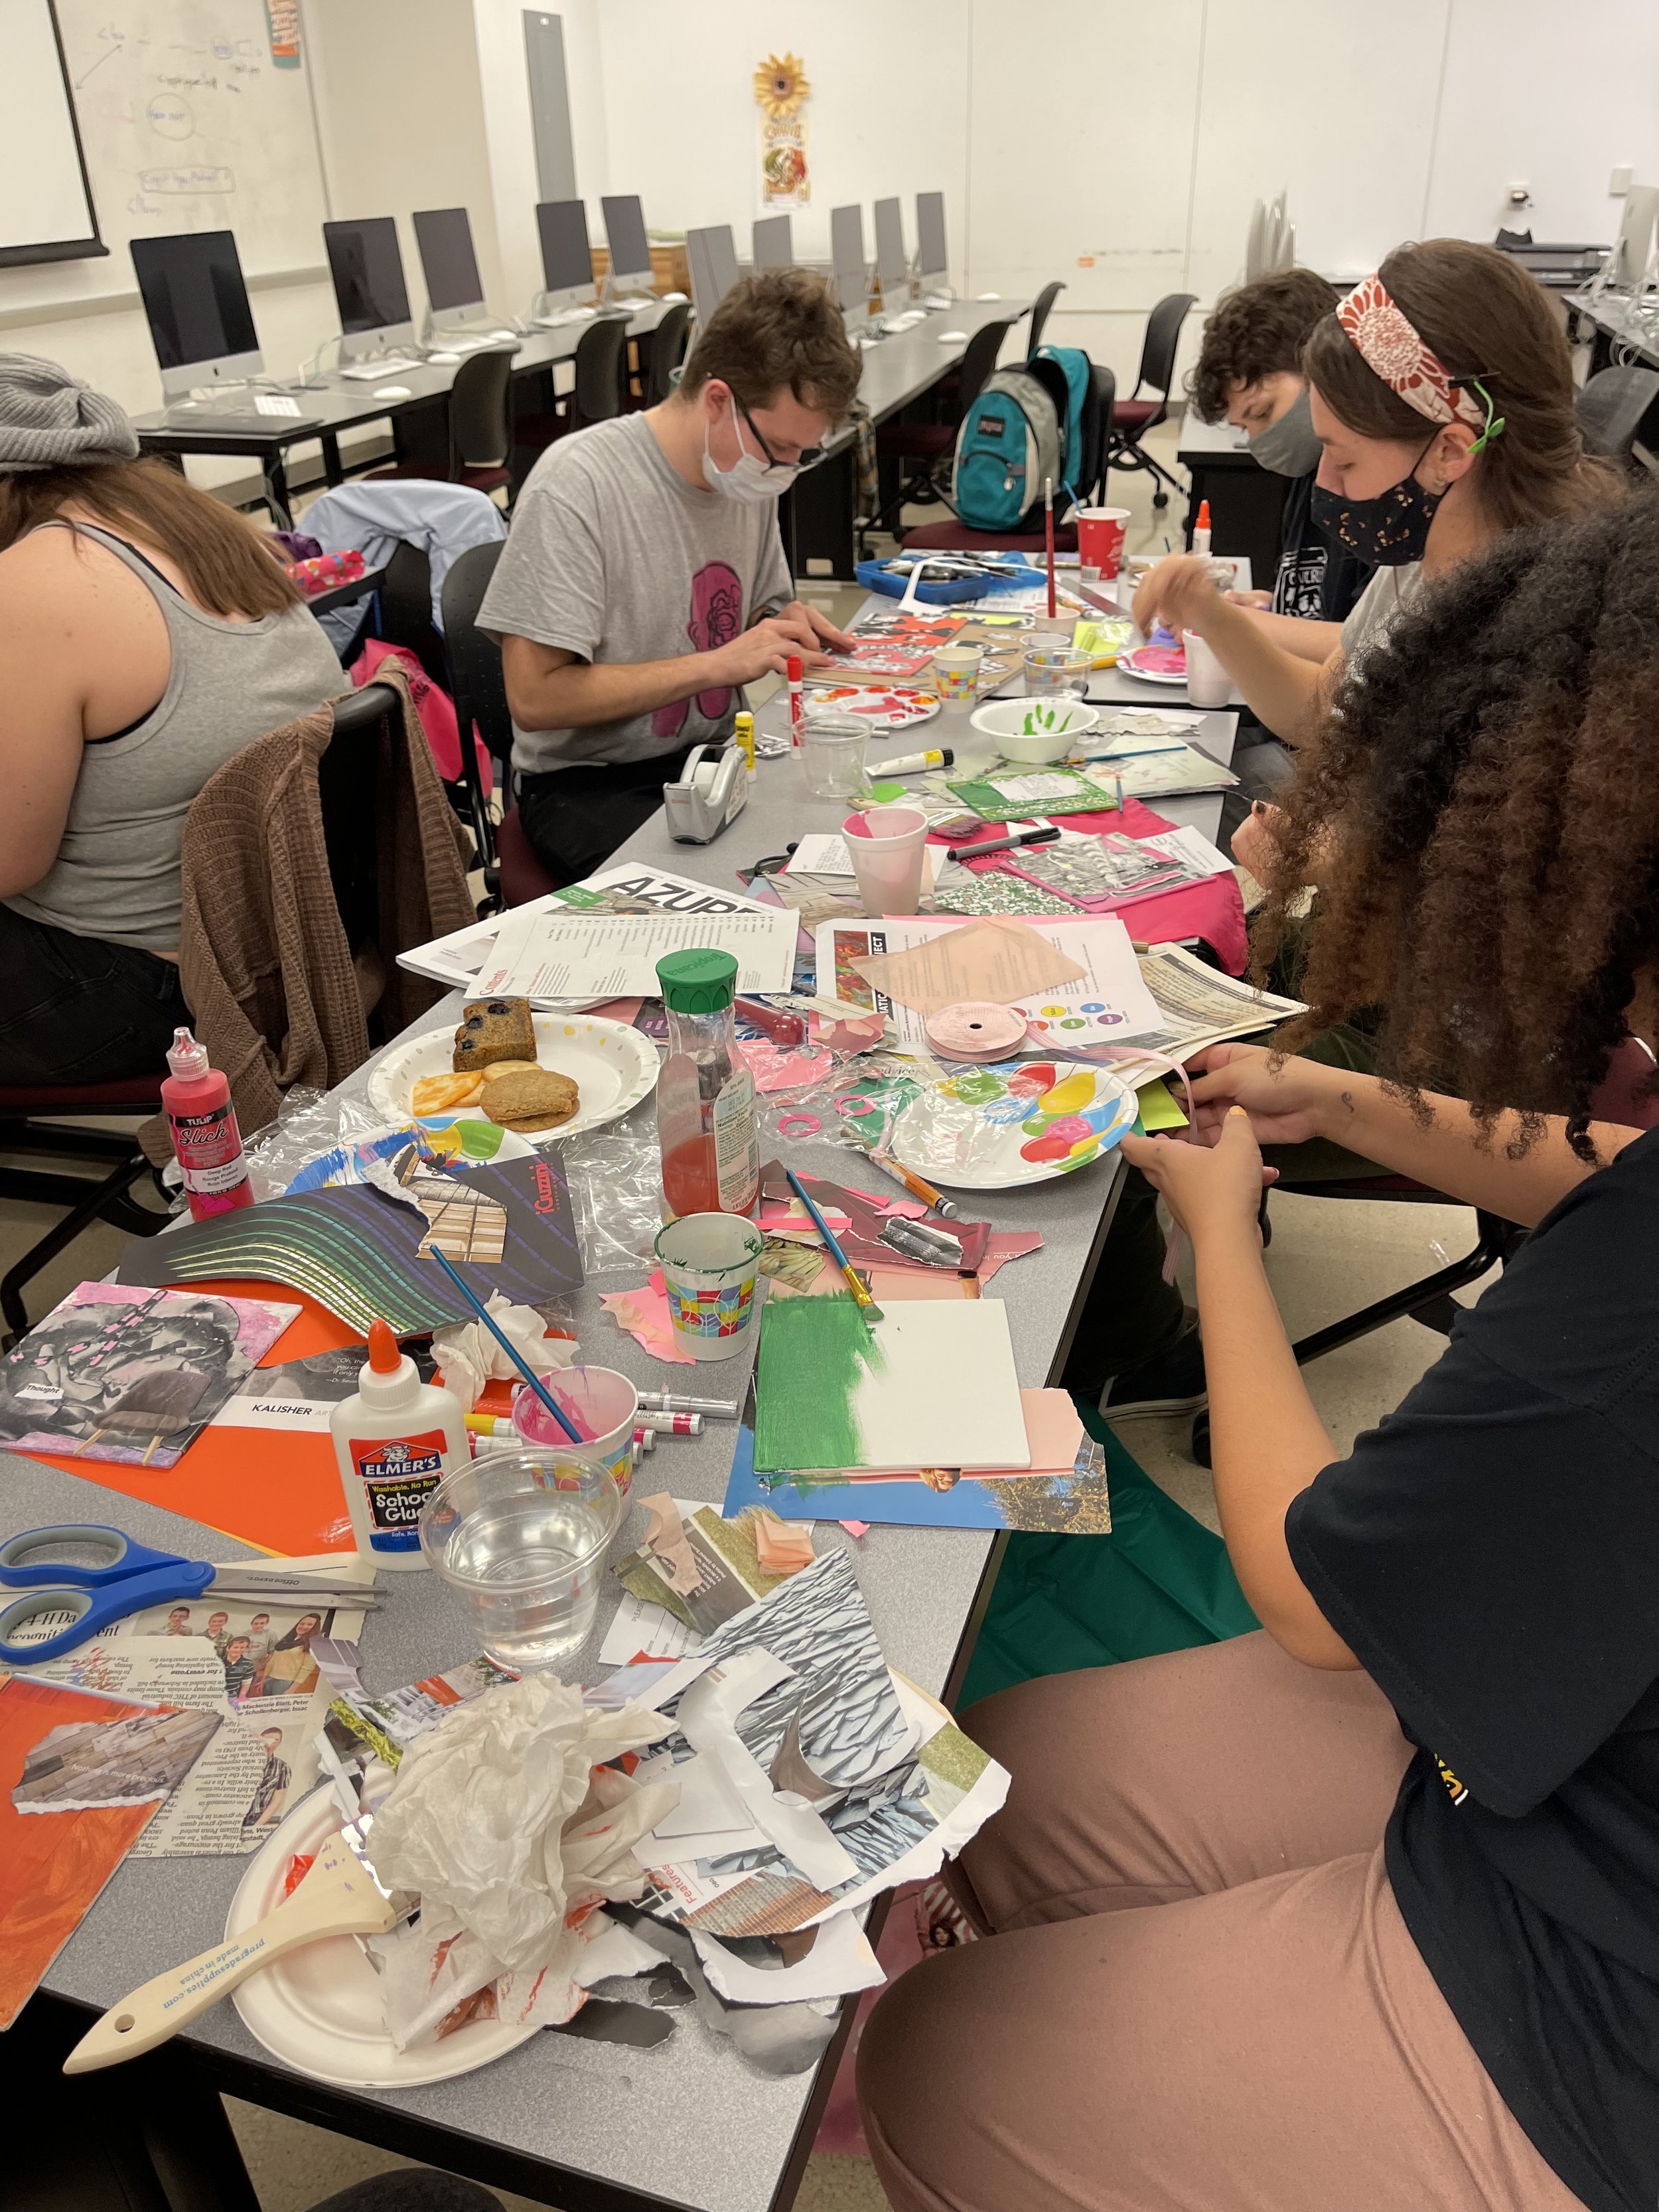
Canvases, paint, markers, and collage materials are available.
We use recycled materials whenever possible.
Your finished tiles are yours to take home if you want.
Instead of comparing your insides
with everyone else’s outsides,
Chromadata compares feelings to feelings.
Data visualization is where art meets statistics.
Graphic artists convert dry numbers, charts and graphs into
compelling images that tell stories.
When a group works together to capture their feelings
in this collaborative project. the result is a snapshot of a moment in time.
The Chromadata project
is good for groups from two to 100 people, and takes about an hour.
Artistic talent or skill level does not matter.
However, high school and college art students have especially enjoyed it. Part of the fun is just sitting together, talking, and working with your hands.


